Showing posts with label acoustics. Show all posts

Saturday, October 27, 2012

Making a Square out of Circles

Let's say you're a marine biologist, and you've recorded a bunch of whales and dolphins, and you want to study the sounds that they're making.  Some of the cetacean species you've recorded will be making sounds too high for you to hear (like porpoises and beaked whales), and some will be much too low (like blue whales).  In addition, some biologists (like the ones who are older or have attended too many KISS concerts, might not be able to hear very well at all.

One of the ways biologists get over this is by turning the sounds into pictures, like this picture of a dolphin whistle:

This is called a spectrogram.

Here, we can see that the whistle starts out high, and then drops down in frequency, and goes back up again. Frequency is on the y axis.

Remember, loud sounds have high amplitude (shown as a darker red in the spectrogram above), and high frequency sounds have a high frequency (which will put them high on the y axis of the spectrogram).


This transformation between sound and picture is done via something called the Fourier equation.  The Fourier equation is really cool - it takes a complex sound, made out of multiple different frequencies, and breaks it up into the component frequencies.  It's kind of hard to picture this happening, so I decided to start with a simple single-frequency sound, and make it into a complex frequency sound, so we could see what was happening in the reverse.

So what complex sound can I make from simple sine waves?  What about a square wave?

Figure from Khin Hooi.

Click here to listen to a square wave.
Single frequency sounds are composed of pure sine or cosine waves, which are rounded like this:


However, we can create a square wave by adding additional frequencies, each one of which is an odd harmonic frequency of the original sine wave, and which is smaller in amplitude by a specific amount. For example, in the first step to making a square wave, we would add sin(3*t)/3 to the original equation for the sine wave, y=sin(t).  Then we would add sin(5*t)/5, sin(7*t)/7, sin(9*t)/9, and so on for the odd numbers until the wave is square enough to make us happy. Here's an animation of the frequencies being added up to make a square wave:


Cool, so now we've made a sound out of a bunch of different frequencies.  The next thing to do is to use our Fourier transform on it, to take it back apart again.

The figures on the left are of the square wave I've created, and on the right are of the Fourier spectrogram of that wave.  In the first row of figures, you can see that there is only one frequency, and the spectrogram only shows one line (the light blue one at the bottom). As I add more frequencies, more and more (lighter and lighter) lines appear on the spectrogram.
I thought this was a pretty good demonstration of how Fourier Transform works. We've made a complex signal, and then Fourier helped us take it back apart again so we could visualize the different sine waves that make up the signal again.

If you can't get enough of this stuff, here's an excellent post I found about building a sawtooth wave.

Also, here's a great little youtube animation of the making of a square wave:


If you have matlab, and want to try this out, email me for the code.

Sunday, September 23, 2012

How loud is that whale, anyway?

When we're thinking about how loud a noise needs to be to damage a whale's hearing, it's important to consider how loud the sounds are that the whale makes itself. If a singing whale makes a sound itself that is at a certain sound level, it is pretty unlikely that it will be deafened by being exposed to a sound of the same level.  This is something like how you are unlikely to be deafened by the sound of your own voice. This isn't to say that continual exposure to sounds at or quieter than their own won't affect whales. It will - just like constant low-noise sounds such as traffic can damage human health.

Calibrating hydrophone sensitivity
curves is very pleasurable.
The first step in figuring out how loud your whale is to drop a hydrophone in the water. Hydrophones convert pressure into voltage (if you're interested in how, I explain here). Hydrophones also have a property called sensitivity, which is a measurement of how quiet of a sound that the hydrophone can hear. The difference in sound sensitivity between a very sensitive hydrophone and a very insensitive hydrophone is like the difference in touch sensitivity between your tounge and your heel. A light touch on the heel might not make any neurons fire, but...

As an aside, in the book "Last Chance to See," Douglas Adams puts a microphone in a condom and uses it to try and listen to Yangtzee river dolphins in China. (Insert nerdy bio-acoustition joke here).

Hydrophone sensitivity is usually listed as a single number, something you will notice if you are a buyer of hydrophones or microphones. This number is negative, and the less negative, the more sensitive the hydrophone. Listing a single number actually oversimplifies things. For example, let's look at the sensitivity of the Reson TC 4024 hydrophone at a range of frequencies between 0 and about 90 kHz. If you remember, frequency determines how shrill a sound is. Barry White, for example, has a low frequency voice, and the Chipmunks squeak their songs at high frequencies. OK, so the "typical receiving sensitivity of this hydrophone" is listed as -173 dB. But, as you can see, the sensitivity actually varies quite a lot with frequency:


Because of this, most people only use their hydrophones to record sounds in the "flat frequency response" region, which, for this hydrophone, is between about 4 Hz and 45 kHz. This flat frequency region is pretty much about equal to -173 dB (and if you want to be really specific about things you can always go back and correct for the variation later - as long as your hydrophone is calibrated!)

You'll probably also need to know your gain. Gain means amplification. Generally, the signals coming out of the hydrophone are still too quiet to use, so we amplify them again.

Finally, we can calculate how loud the whale is. So here we go:

Sound Pressure Level = Sensitivity - Gain + 20 * log (Voltage from the Hydrophone)

It's actually pretty simple once you know what all the numbers mean...

... except for the fact that, by convention, the Sound Pressure Level is measured at 1 m from the sound source. So, if we are working with wild animals, we will either have to get incredibly lucky, or we have to figure out a way to deal with attenuation of the sound in water. Attenuation is a fancy word that means "makes quieter." For example, sound-proof walls attenuate the sound of your neighbor's Eminem music.  I'll deal with that one a little bit later.

You almost never get this lucky. Photo by Flip Nicklin.

Tuesday, September 18, 2012

Why Can't We Directly Compare Sounds in Water and Air?

One of the biggest, and most common, mistakes that people make when writing about underwater acoustics is making direct comparisons between the loudness of things in water and in air.  Here's an example of something that you might read about underwater sound:

"The bottlenose dolphins were being exposed to sounds up to 160 dB.  That's  louder than a 747!"


Well, actually, it's not.   

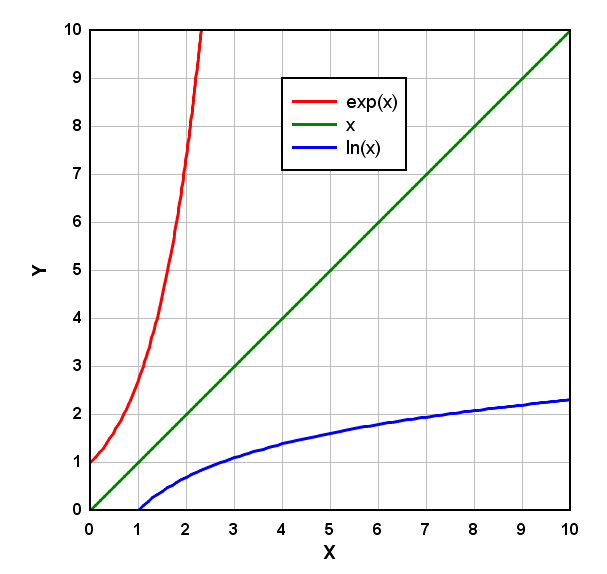
The problem here is related to the units with which we measure sound. First of all, we measure sound using the decibel.  Decibels are logarithmic units. Basically, logarithmic scales allow us to make big numbers smaller so that they are easier to visualize. For example, in the chart below, you can see that when we take the log of value for x (in green), the log values (in blue) are decreased more for large values of x than for small values of x. The opposite is true of taking an exponential of x, such as x^2 (in red).


Why make things so complicated when we talk about sound? Well, human beings actually perceive sound pressure in a log scale.  For example, you wouldn't really be able to tell the difference in loudness between 6 trumpet players and 7 trumpet players, because your brain doesn't process sound lineally. In fact, every time you want to change the loudness level by just three measly decibels, you have to double the power.  So, if you want to increase the loudness of your trumpet players by 3 dB, you'll need 6 more trumpets.  

Doublemint gum only makes you 3 dB louder, just ask the dolphins.

OK, so now we understand decibels, why can't we compare dB in air with dB in water?

First of all, decibels must always be referenced to some standard. In air, decibels are referenced to 20 micropascals (pascals are a unit of pressure). In water, they are referenced to 1 micropascal.  This means that, from the start, 26 dB must be added to the sound level to make the two references levels the same.

Secondly, water is much denser than air, so the effects of pressure are also different. Although it is possible to compress water, it is much more difficult to do so.  In fact, when we add the difference in densities between air and water into the equation, we find that the sound pressure in water is 60 times greater (or 35.6 dB higher) than the same value in air.

Loud, but not as loud as a plane. Photo from the CRRU.
So, if white-beaked dolphins are producing whistles that are between 139 and 148 dB, that doesn't mean that they are making sounds louder than a 747. If we convert those numbers to values in air, we get somewhere between 103 and 113 dB.  Which is still pretty darn loud, but not quite as loud an airplane engine.  It's also good to point out that dolphin whistles are "narrowband" sounds. I explained narrowband in an earlier blog post, but basically what this means is that you can't imagine a whistling dolphin sounding like a jackhammer, because the sounds cover a very different range of frequencies and are produced by very different mechanisms.

So, next time you read something comparing underwater sound compared to sound in air, check to see if they did their conversions right!

Monday, September 17, 2012

A wave is a complicated thing to equate

I am only studying chapter 1.2.1 of my big scary bioacoustics book, and already I'm running into some scary maths (tm). However, my advisor has told me that I don't have to actually know how to derive the equations, just understand them conceptually (Apparently I am getting my PhD in Zoology and not Electrical Engineering - could have fooled me!).

I use sound to study whales in the ocean. Understanding sound is absolutely essential to my research, and to understand sound, you've got to understand the wave equation.

We're not going to actually derive the wave equation, but it's important to know what goes into it. (if you want to see the real math, look here). In order to understand waves, you need to understand four other fundamental laws. The great thing about these laws is that they pretty much are telling you that waves obey the laws of physics. By the combined powers of these laws, Captain Wave equation emerges!

Conservation of Mass: This means that even though the number of molecules in any part of the volume that  sound passes through may change, the total number of molecules in the volume stays the same.

In the sound wave, molecules get more
compressed, but don't appear out of thin air. 

Equation of Motion (Newton's Second Law): This means that we can calculate the force acting on particles by multiplying their density when a sound is passing through them by their acceleration.

Force = Acoustic Density * Acceleration

Equation of Force: With this, we can use the total density of the fluid (which is different from the acoustic density) and divide it by the x movement of the particles to find the force acting on the particles.

Force = Total Density differential * x differential
Equation of State: This tells us that acoustic pressure is related to how easily the medium through which a sound travels is compressed. Some people think that liquids and solids can't be compressed, but this isn't true. The reason we generally consider liquids to be incompressible is that it is REALLY REALLY hard to compress a liquid. I couldn't do it, even if I worked out a LOT.  However, liquids at the bottom of the ocean have the weight of tons of water sitting on top of them.  The weight of all this water presses down on the liquid, pushing the molecules closer together. In fact, if you have enough pressure, you can even compress rocks. Here's my version of this equation:
Pressure = (squishiness / acoustic pressure) * pressure

When you put these four equations together, you get the wave equation, which uses all four to describe the movement of a wave. This equation factors in pressure, time, the speed of sound, and the movement of particles.

Why is this important to a whale researcher?  Well, if I want to use sound to study animals underwater, I need to understand that sound travels differently in different types of water. In the ocean, things that might change how sound travels are depth, salinity, and temperature. If, for example, a beaked whale is clicking at 5000 m, and I am recording it at the surface, I can't assume that the sound is traveling in a straight line from the whale to me. As the depth and temperature changes, the way sound moves through it will change. I need to be mindful that these things can change how sound moves through the water.

I warned you this was going to be dense. And that was only chapter 1.2.1.

Also, if I made a math mistake, and I messed up on understanding any of the equations, please comment!


Tuesday, May 8, 2012

We Should Have Studied Dolphins in High School Math

When I look back at my educational career, it's really striking how poor of a student I was.  That is, I was a pretty mediocre student in the "hard" sciences until I took Marine Biology class during my senior year of college.  Most of the time, I think I was just really bored.  It wasn't always because the material wasn't challenging or useful (although sometimes this was the case). It was often because I had no idea what the point of it was.  OK, so in physics we could calculate where a ball would land based on the angle and force.  I only played baseball when forced to in gym class, and when I did I had no control over the force and angle of my wild swings.  I didn't have a home catapult, and I just didn't get how this stuff could really matter to ME.

It wasn't until I got really interested in marine biology, and specifically whale and dolphin bioacoustics, that I started seeing how amazing and cool math & physics can be.  If you read my blog, you know that bioacoustics is the study of the sounds of living things.  Whales and dolphins use sound to communicate and find food underwater, so even if you can't see them, you can very often hear them.  Some whales, such as beaked whales, are actually easier to find by listening than by looking with your eyes.  In addition, sound travels further underwater than light, so people at the surface can even hear whales that are thousands of feet underwater, or even hundreds of miles away. We can use these sounds to track the location of the animal, and we can do it using high school math.  Super cool.

Why didn't we do this in my high school trigonometry class?

It's really pretty simple.  First, you need something in the water making a sound.  Let's say... a whale.


Then you'll need a boat and something to record the sound.  We're going to use a hydrophone array, which is made up of three underwater microphones (hydrophones) strung in a line, with 15 meters between each hydrophone.  


When the whale makes a sound, it travels in a straight line through the water* to each hydrophone, arriving at the closer hydrophones sooner and arriving at the further hydrophones last.  Let's say the sound arrives at our recordings at time 0 for hydrophone 1, 0.006 seconds for hydrophone 2, and 0.0007 seconds for hydrophone 3.


How on earth do we figure out the distance to a whale when all we know is the difference between when we heard it on hydrophones 1, 2, and 3?  Easy - there's a simple equation for that!


The sound speed in water is 1500 m/s (which is why I put the hydrophones 15 m apart - to make the math easier).


We've replaced some of the words with numbers, something I HATED in high school.  Oh wait, I still hate it, so I'll just explain what the equations mean: The time difference between hydrophone 1 and 2 (t21) is equal to the difference between the distance between the whale and hydrophone 1 and the distance between the whale and hydrophone 2 (d2-d1) divided by the speed of sound.  Holy mother of god, this is just geometry!  I could have been doing this when I was 15! Some of you over-achiever types probably took geometry in 8th grade, so you could have done this when you were 14. Not me!

With a little algebraic rearrangement (which I am not going to bore you with, since you can look it up here), we get:

**


Sx and Sy are the x and y locations of the whale. C the speed of sound in salt water, 1500 m/s.  dh is the distance between the hydrophones, which in this case is 15 m, and all the ts refer to the time difference between the hydrophones (the small numbers tell you which two hydrophones: t21 is the difference between the arrival at hydrophone 2 and 1, etc).  All you have to do now is plug in the numbers. Edited 5/12/2012: To make it even easier, I've provided a spreadsheet here.


**


Then you can graph the location of the whale (-16.7, ±241.7), along with the locations of your hydrophones at (0, 0), (0, 15), and (0, 30).  I've just made designated hydrophone 1 at (0, 0) to make things easy, but in real life you'd have a GPS on the boat and you'd have to add the length of the hydrophone cable to the location of the boat's gps.


You might notice something funny about this equation - it actually gives two solutions - one on either side of the line of hydrophones.  That's a big problem with using three (or four, five, etc.) hydrophones in a row - you're not really sure what side of you the whale's on.  The reason for this is that there are two possible solutions for Sy. However, you can figure out which side the whale is on by turning the boat.  The location that stays in relatively the same place regardless of where the hydrophones are is the correct one.  Other ways to fix the left-right ambiguity? Make your hydrophones into a 2D shape (hard to do when dragging them behind a boat because 2d shapes are not very streamlined)*** or use DIFAR.

I wish I had done this kind of math in high school - it is totally within the realm of a high school student!  I think I might have paid better attention to something cool like finding whales.  On the other hand, maybe not.  That boy across the room WAS pretty dreamy.  Not all kids will be interested enough in whales and dolphins to get interested in math and physics, but the cool thing about math and physics is that, regardless of what you're into, I bet it applies.  From video games to raising miniature ponies, there's math in there somewhere.  Sometimes it just takes the right spark to get people interested.

P.S. If I made any mistakes above, please call me out.  Like I said, I didn't do so well in math class.  Also, if you're interested in a copy of the xcel spreadsheet with the equations already in it, shoot me a message and I'll send you a copy.


* This isn't always the case - sometimes the sound bounces off the bottom or the surface to get to the hydrophone, but I'm ignoring those cases here for simplicity.

** Edit: May 9, 2012. I made a HUGE mistake the first time I posted this and completely ignored the equation for t1 (I thought t1 was a typo for t12).  This is now fixed.

*** Edit: May 8, 2012.  Changed "3D" to "2D" because of a comment from Sam Denes. I had thought a straight line was already 2D, but apparently a straight line is 1D and adding another point off the line makes something 2D.

Note: I got to talk to a bunch of high school math teachers about this math.  Recap here.


Monday, March 12, 2012

Turning Whalesong into Rainbows: 1000 Numbers to 1000 words

Art by Casey Roberts
Two weeks ago I wrote about how sound gets from a whale, and into your computer.  At the end of that post, I included a pretty rainbow-colored picture of some dolphin whistles.  But I didn't ever explain how all that digital data got translated from zeros and ones into a nice pretty picture.


Why are pretty pictures important to science?  Awards are given out every year by several prestigious groups for the best images in science and biology.  These images are not only beautiful, but they often help us understand complex concepts that are difficult to understand using words alone.  For instance, I can tell you that dolphins have fat deposits in their jaw bones that help transfer sound into their ears, but the following picture by Darlene Ketton's lab at Woods Hole really shows you how the auditory fats (orange) connect up with the inner ear bones (red) to help the dolphin hear.  This picture does a better job of communicating the concept than I could do in 1000 words, AND you're not bored to death, either.


A 3-D image generated from a CT scan highlights selected
 tissue groups of a bottlenose dolphin's head. 
 (Courtesy of Darlene Ketten, WHOI)
Humans process most of their information visually, so we often need to translate acoustic information into visual information.


The acoustic data that I collect in my research is stored as binary data, which means that it is stored as a bunch of ones and zeroes, like this: 


01001000 01100101 01101100 01101100 01101111 


Each of these sets of ones and zeros corresponds to a letter or a number (the code I just used says "Hello"). Unfortunately, I can't look at binary code and understand what it means, because I'm not Neo from the Matrix.  Alas!


However, my computer understands the language of binary, and it translates all of these ones and zeros into slightly shorter strings of numbers, which look something like this (except a whole lot longer):

0.000113379 0.000136054 0.00015873 0.000181406 0.000204082 0.000226757

Not really a whole lot better, is it?  

2-D

Fortunately, I know that these random-looking numbers are the pressure values for a sound wave that has been measured 80,000 times every second. This means that the first number has a time value of 0, followed by 1/80000, 2/80000, etc.  Now that I know what the time values are, I can make graph with time on the x axis and the value for pressure on the y axis, like so: 

This is better: I can see that the sounds get louder and softer over time.  If the sound is louder, it will make bigger bumps on the graph, and if it is quieter, the bumps will be smaller.  It's still pretty hard for me to pick out the different sound frequencies, or pitches.

I can kind of see what is going on here, but it is like looking at only one line of pixels from an image of Marilyn Monroe; I don't really know what is going on [A]:


Fortunately for me, a French mathematician named Jean Baptiste Joseph Fourier (1768-1830) figured out a way to represent a continuous periodic signal (like a sound wave) as the sum of a bunch of sine waves.  This means that I can break up the signal above into a lot of simple sine waves.  I can also do the opposite, by adding up a bunch of simple sine waves to create a complicated one [B]:
Adding two sine waves together.
The top four waves combined (light blue) create the more complex wave at the bottom (dark blue) 

Even REALLY complicated waves, like this one, can be created by combining fourteen simpler waves:


2-D Again - Frequency

Once we break the sound up into its component frequencies, we can create a different picture.  This picture looks at how much of the sound is made up of each frequency.  For example, in this picture we are looking at the relative contributions of different frequencies to a sound recording.  You can see that there are more low sounds than high sounds, and that there are two small "peaks" between the frequencies of 1250 Hz and 1500 Hz.  (Hertz measures the frequency of a sound.  You can hear between 20 and 20000 Hz, depending on your age.) These two small peaks are actually the two frequencies at which the humpback whale is singing at this particular moment in time.

Now, it's like I'm looking at that picture of Marilyn vertically, but still only one row at a time.


Let's recap: To make a picture of a whale song, the computer breaks up the original sound recording into hundreds or thousands of individual segments.  For each of these segments, it does a Fourier Transform, which breaks the sound wave up into its component frequencies and creates the graph shown above.  

Next, the sound values are assigned a color.  Loud sounds are generally shown as red, and quiet sounds are blue.  If we stack these values next to each other, we start to see more of the picture:  


As more and more Fourier transforms are combined, they create the picture below, which shows the whistles of two common dolphins recorded in the Irish Sea. This picture allows us to see several important parts of the sound at once - how long it is, how loud it is, and how shrill or low the noise is.  I guess it's no lady in a red dress, but it's a whole lot more useful to me!


[A] Of course, this is not a perfect analogy, because a sound waveform is a combination of all the different frequency parts.  

[B] The explanations in this post about Fourier transform are grossly, extremely simplified, and skip over most of the math.  If you want a more thorough explanation, please see The Scientist and Engineer's Guide to Digital Signal Processing.  If you have any comments on my over-simplification, please leave them on the post or shoot me an email. 


Sunday, February 26, 2012

New Age Science: Magic Crystals and Whale Songs

It is unclear if these people
have a permit, but their lack
of clothing is very clear


Whale song - almost everyone's heard it somewhere.  It's especially prevalent on new-age CDs, usually combined with the sounds of the pan flute.  Scientists don't generally play wind instruments to whales: it's actually illegal to play sounds to whales without a permit in the United States.  Recording whale song is not illegal, as long as you don't get closer to the whale than 100 yards.  But how does the whale's song get from the whale into your iphone?

I've already talked a little about how dolphins produce sound.  The method of sound production for whales is less well understood, so let's just start with the sound once it leaves the whale's body and enters the water.

A humpback whale and
hydrophone, photo by
Flip Nicklin
Like most sound, the sounds of whale songs are a result of vibrations.  These vibrations compress and expand molecules in the the water around the whale, so the molecules are squeezed together and then spread apart.  What we think of as "sound waves" are really a measure of the amount of pressure on the molecules in the water.  This is similar to what happens when you hum: as the vocal chords in your throat move back and forth, they create changes in pressure in the air around you. Here's a little video showing how molecules are moving when you hear a sound:


The applause for "Sound and Pressure" in this video is particularly poignant.

We can't usually feel the pressure of sound waves anywhere but our ears, unless the sound is really loud, like when you stand too close to the speakers at a rock concert.


Quartz, topaz, salt, sucrose (table sugar),
bone, and even silk have piezoelectric
properties. Smashing raw quartz against
the head not recommended to activate
these properties.
Now we know that sound is made of pressure waves, but how can we convert those pressure waves into the electrical signal we need for our recorder?  This is where the new-age folks would really get excited: we're going to use some "magic" crystals.  In 1881, a man named Gabriel Lippmann came up with the idea that if we squeeze certain types of "charged" crystals, we can create an electrical current.  This theory was later demonstrated by the famous Curie family, of radioactive fame.

Charged crystals are made up of thousands of molecules, each of which has a positive and negative charge.  When the molecules are "relaxed" (when you're not squeezing them), the charges balance out.  However, when the crystal is squeezed or bent, the charges are forced together or apart, creating an electronic charge on one side of the crystal.  Modern piezoelectrics are generally made of ceramic, which are coated on either side with a thin layer of metal.  You can see a modern piezoelectric crystal if you dissect the earpiece on your headphones or a singing card from the grocery store.

Note: I found an almost identical figure on a creationism site, as evidence of creationism.  They claimed as evidence that quartz is the only natural piezoelectric material.  As we see above, this just isn't true.

Compression of the crystal
results in a change in electrical
charge, measured in volts (V).
The whale sound increases the pressure in the water.  This compresses the crystal, which creates an electronic charge on each side.  Wires attached to the crystal lead up to the computer on your boat, usually via a pre-amplifier.  A pre-amplifier is just what it sounds like - it makes things louder (amplifies them) before (pre) they go up the wire and into your computer.  Pre-amplifiers are sometimes necessary because the change in charge created by the crystal is too small to travel up a long wire.

Even when the electrical charge has gone all the way up the cable, and into the boat, it isn't done yet.  It still needs to be changed from an analog to a digital signal.  Today, we generally use computers and other digital devices (ipods, hard drives, etc) to store our data and music.  Analog data is continuous, like a sound wave.  Digital data is not continuous - it takes many many samples along a sound wave. In the figure below, we can see the analog sound (in blue) with the digital samples (red).  This is probably why many hipsters people think that records are better than digital sound - because digital recordings don't keep track of most of the sound wave.


A great example of analog recording is the vinyl record.  If you don't know what a record is, you're either very young or not a hipster.  When you play a vinyl record, a needle runs down a continuous groove in the record.  As the needle moves down the groove, it vibrates up and down.  These vibrations travel up the arm of the record player, and eventually to a piezoelectric crystal (you know this one already!).  The crystal converts the vibrations to an electric signal and sends them on to your speakers.

Scanning Electron microscope photograph of the groove
 in a record, by Chris Supranowitz.

In contrast, the data on a CD is stored digitally.  Each CD is engraved with millions of tiny dots and dashes, which your computer reads with a laser and translates into music.

Scanning Electron microscope photograph of a CD, 
After an analog to digital converter has changed our electrical signal into thousands of data points, we can finally listen (and look) at the recordings we've made. As it turns out, physics, chemistry, materials and electrical engineering, and biology have all been necessary to get the sound from the whale and into the computer.  Whether you're doing yoga (like my friend Sheldon) or desperately trying to finish your thesis, there's a lot of science behind those sounds!

Bottlenose dolphin recordings from my acoustic research.